- Viewing & data logging of up to 100 channels simultaneously
- Logging files (.csv) saved to Excel
- Representation of peak, valley & delta
- Data graphs
- Programmable mathematical function for displays
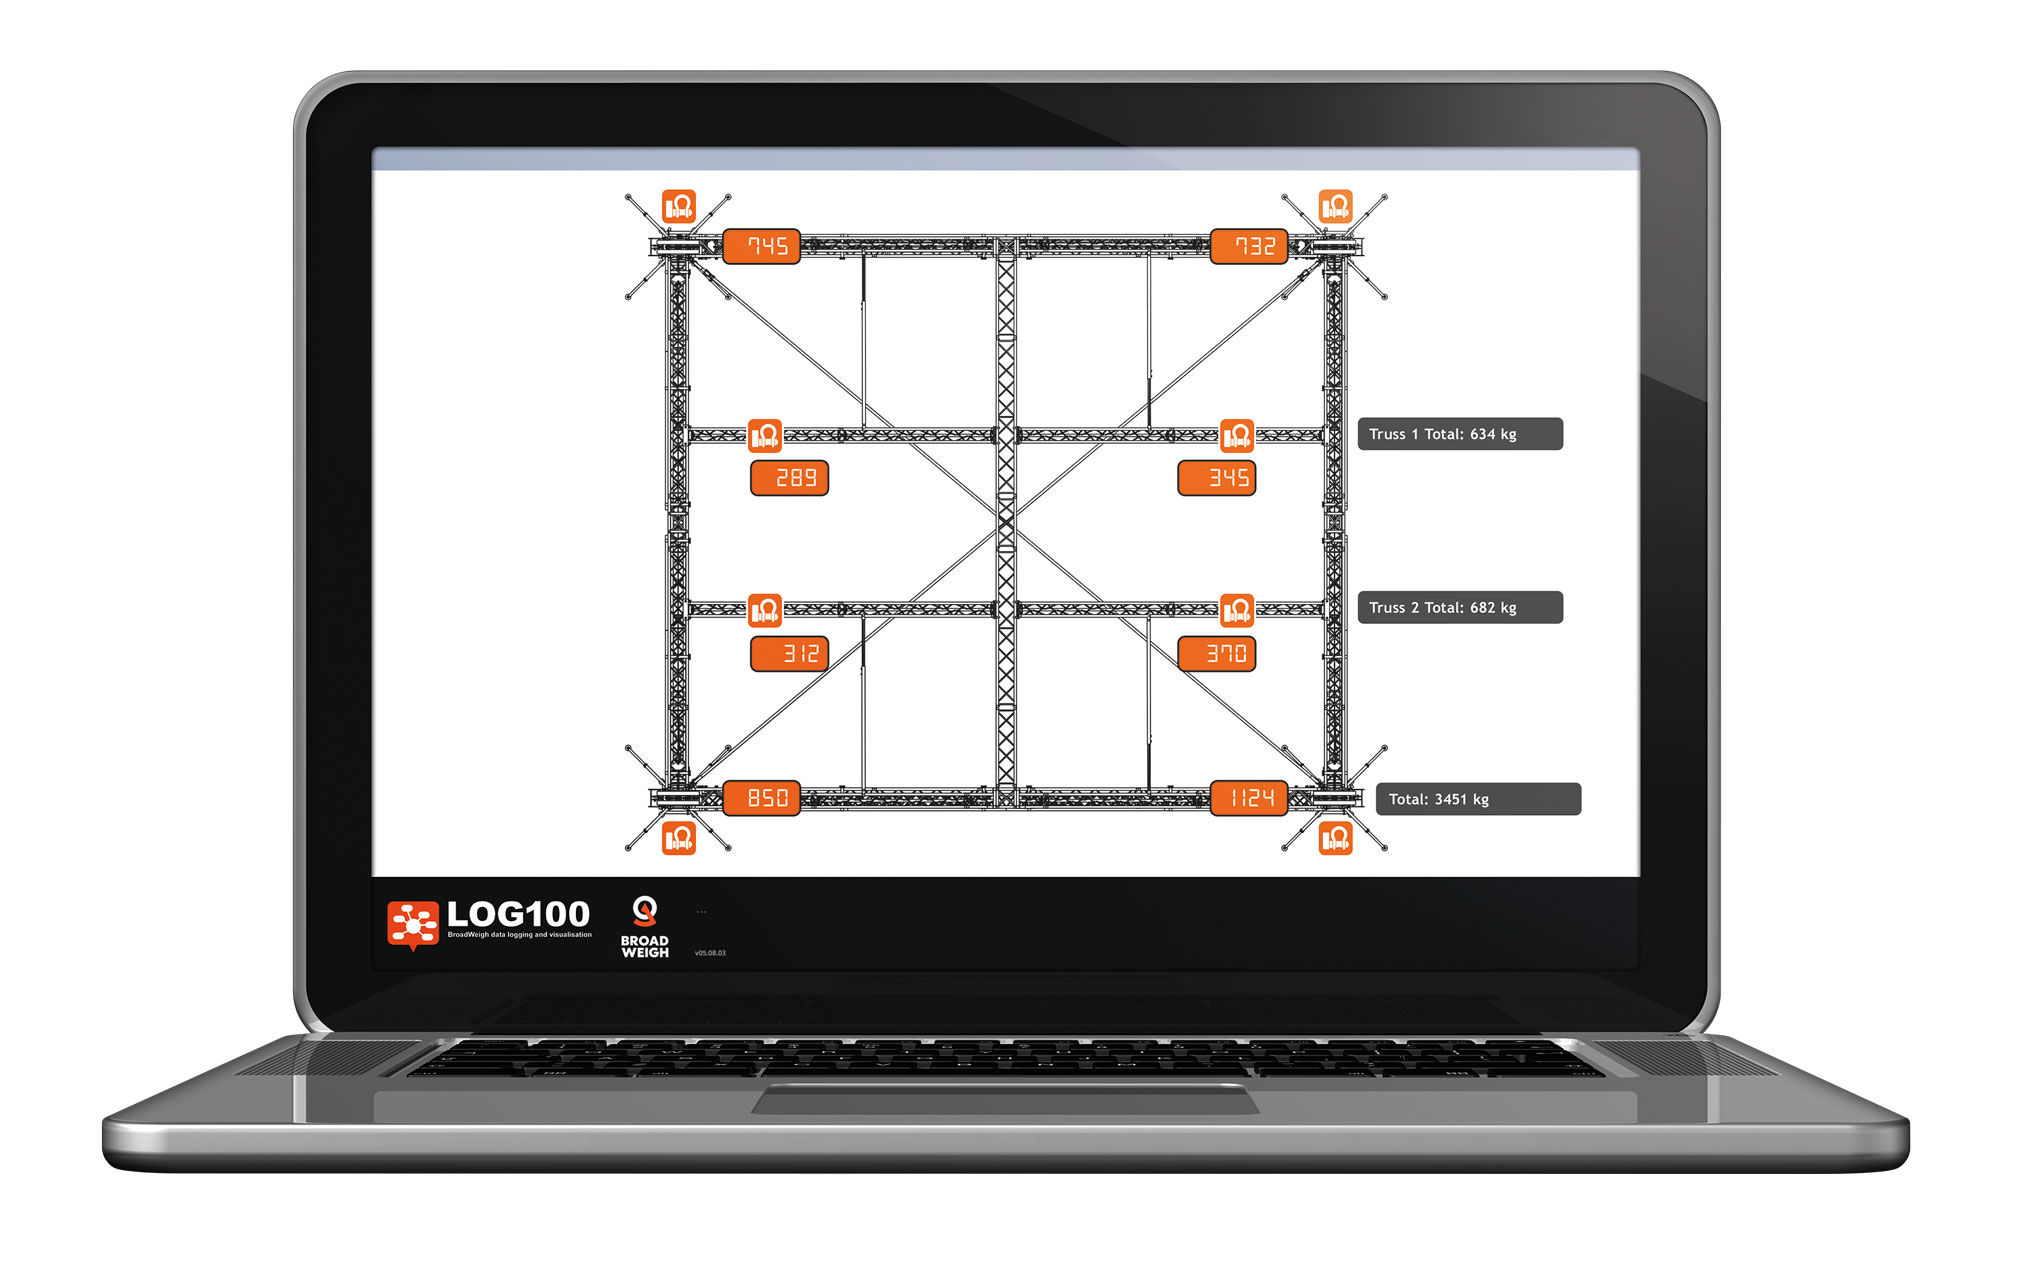
- Graphics feature that incorporates drawings and pictures into the display
- Remote access to data using tablets and smartphones via Webserver feature
- Log feature includes automatic, manual & overload settings
- Audible & visual alarms
DATA LOGGING & VIEWING SOFTWARE
LOG100 logging & viewing software provides visualisation and data logging of up to 100 sensors. The software can log on demand, at pre-set intervals, on entering and leaving a pre-set overload and during an overload. Visual displays and audible alarms can indicate under and over range as well as loss in communications.
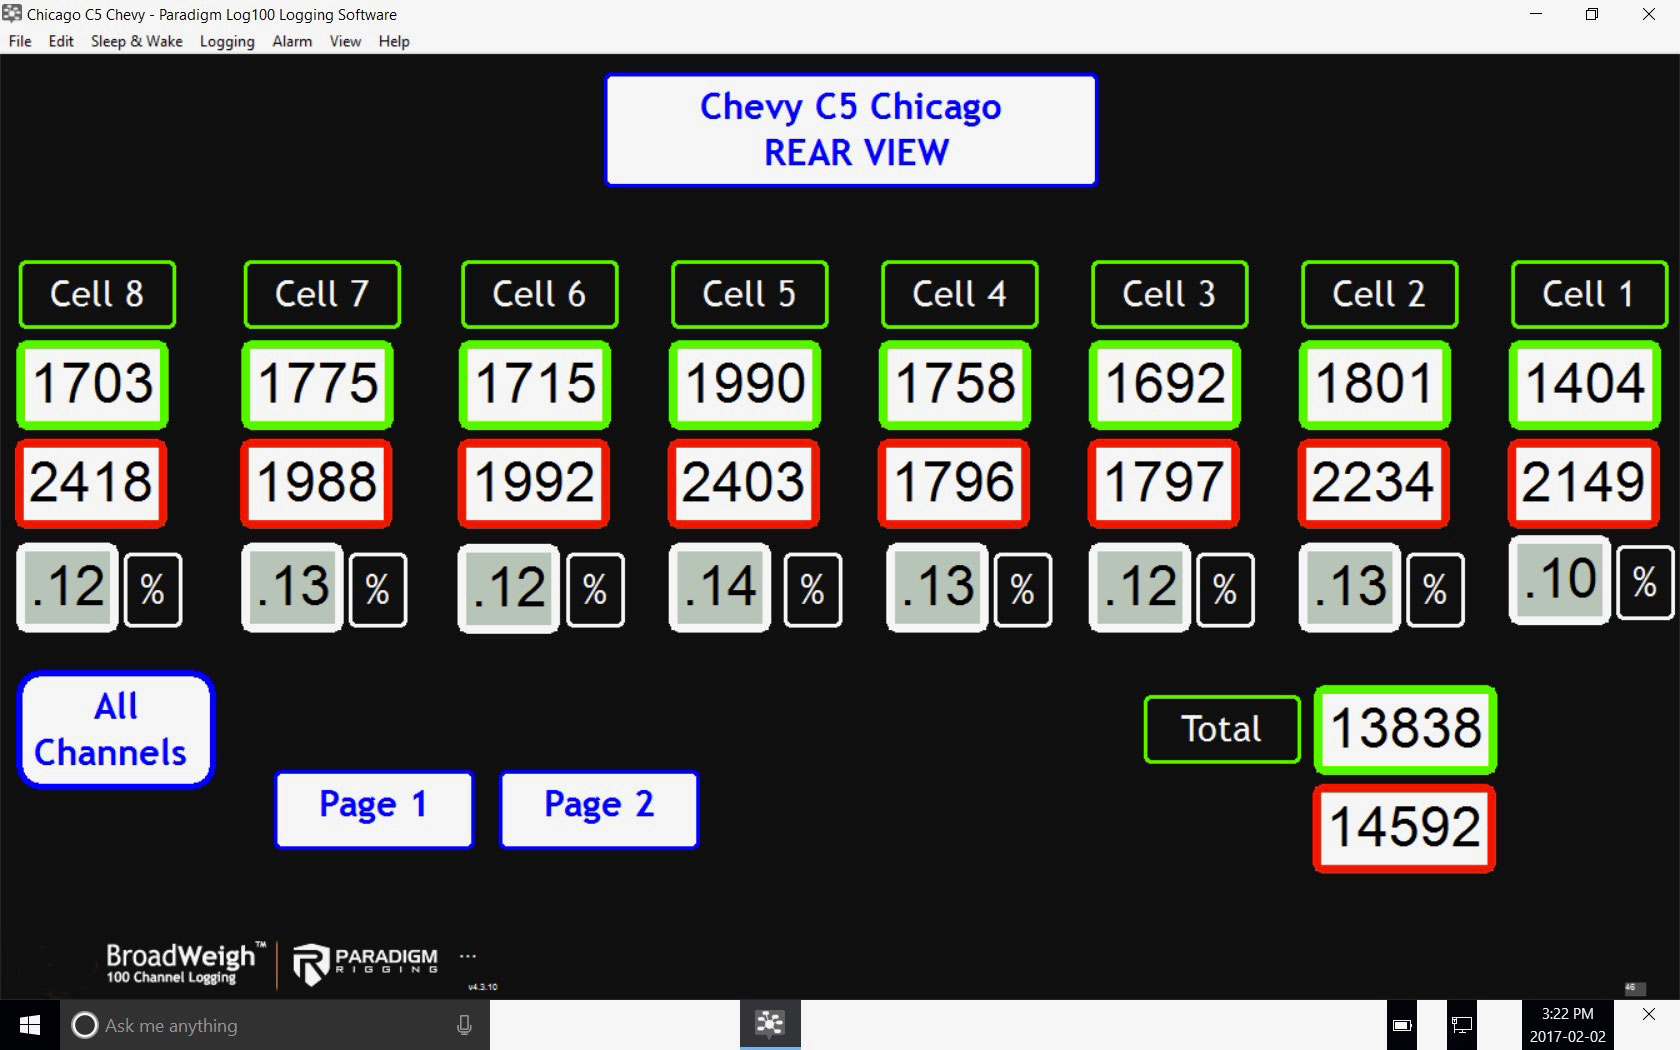
In channel display mode, up to 100 display channels are shown. These automatically resize to fit the window. These display channels can reference transmitters or other channels with mathematical functions applied to them. This allows for easy summing of channels or even calculation of loads in bridle legs. Individual channels show visual alarms for communication loss or battery low. Audible/visual alarms can be individually set to trigger at different levels.
Logging of data can be automatically initiated at an overload point or when approaching or leaving overload. BW-LOG100 also allows logging on demand (snapshot) or at set intervals.
Data can be viewed remotely using tablets and smartphones via BW-LOG100’s inbuilt webserver.
BW-LOG100 has a graphics feature that incorporates drawings and pictures into a separate window. As well as allowing providing tools to incorporate images such as JPG, GIF, PDF and DXF into the display, it also allows values to be placed anywhere on the screen. BW-LOG100 provides up to 16 pages of this graphical display allowing viewing of only parts of a rig or the whole picture.
The software does not take advantage of 64 bit operating systems nor direct advantage of multi core processors, but is compatible with both.

Also see SensorSpace Data Storage and Analytics for a customisable cloud-platform to monitor the status of your Broadweigh sensors, anytime, anywhere. SensorSpace offers up to 3 years data storage, visualisations of sensor data via dashboards, automatic event alerts via SMS, email, app-based alerts and more.


